 , where
v = 1, β = 0.5, as seed to the aggregation function
  .
This applies to § 5.2,
 Fréchet, of
Extreme Values, Invariance, and Choice Probabilities. Using the following cdf,
First, apply the Fréchet distribution,  , where
v = 1, β = 0.5, as seed to the aggregation function
  .
This applies to § 5.2,
 Fréchet
, of Extreme Values, Invariance, and Choice Probabilities
.
Using the following cdf,
where a = b = 1, we let
Differentiate twice to find the density function of the cdf, producing
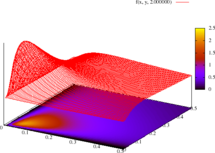
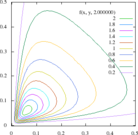
Function f(x, y, ρ) produces the following plots at ρ = 2. The first plots the function value at the given co-ordinate points, the second plots line contours, and the third renders the contours over a colour spectrum. Notice how the plot clusters along the diagonal.
Full-size
Full-size
Full-size

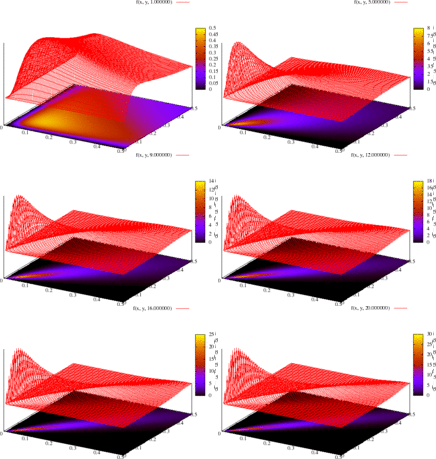
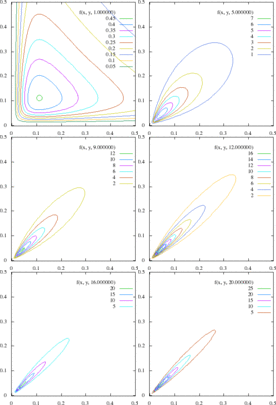
The following are animations of a monotonically-increasing value of ρ = 1, ..., 20 for f(x, y, ρ).
Full-size
Full-size
Full-size
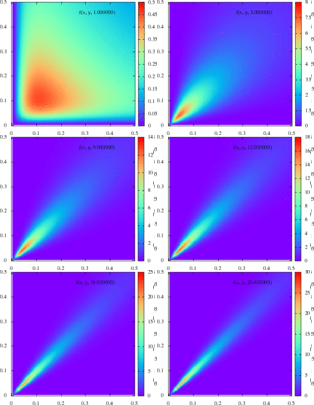
Below is a listing of available stills in EPS (full-colour and monochrome Encapsulated PostScript) for easy type-setting and PNG (full-colour Portable Network Graphics) for multimedia. They're arranged by type (three-dimensional plot, contour lines, spectral contours) and variable ρ for function f(x, y, ρ).
← Back to index. Kristaps Dzonsons, $Date: 2011/03/08 11:13:50 $