overview
Slant is an open source, minimal remote system monitor. It models host fitness via a set of numeric quantifiers, for instance, CPU usage quantified as a percent average over all CPUs, memory usage over available memory, number of processes over maximum configured, etc. For past behaviour, slant maintains a set of time-interval-bound circular queues (hourly, daily, etc.) with current data aggregated into each time series. An important design decision of slant is that each monitoring host retains its own [bounded] history.
Slant is not designed for detailed analysis: there are plenty of other tools for that. (Monit, zabbix, etc.)
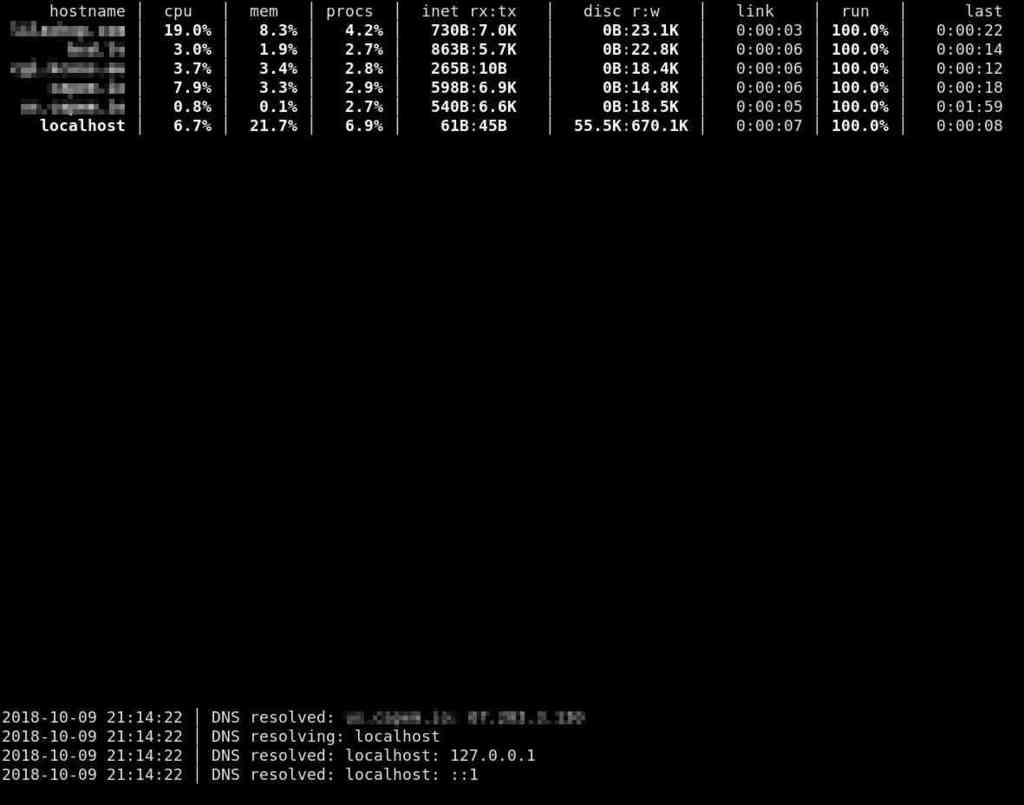
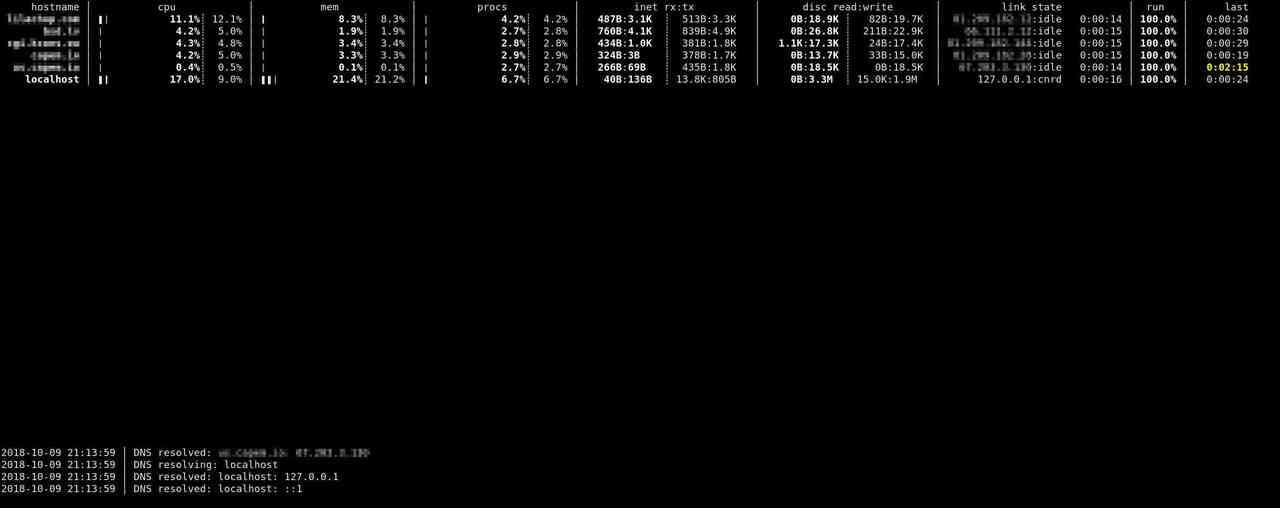
The current version of slant has a single
graphing front-end inspired by top.
The goal of this tool is to answer, at a single glance, the question
of has anything gone to hell with my systems
.
operation
Slant currently runs on OpenBSD only. It's currently being ported to some other UNIX (especially BSD) systems. The source code is in clean, well-documented C code.
There are two main components of the slant system. The first is the server; the second is the client.

The server is divided into a collector, slant-collectd(8), which
collects system statistics and writes to a database; and a CGI
script, slant-cgi(8), which exports
the database to clients.
The collector is a simple daemon that interacts with an SQLite database via sqlbox.
The database is well-documented and consists of a set of circular
buffers for accumulating historical data.
(There is also an instantaneous buffer, which averages
only
the last entry.)
The database is in practise bounded in size, seeming to average in
size to 50K.
The full transmitted JSON output is about 100K, compressed 17K.
The JSON is well-documented in slant-cgi(8).
The current client, slant(1), is a fully-configurable ncurses system. It has simple defaults for laying out monitored data (according to screen size), and all output may be customised in the configuration file. The utility and its configuration are well-documented in slant(1).
data
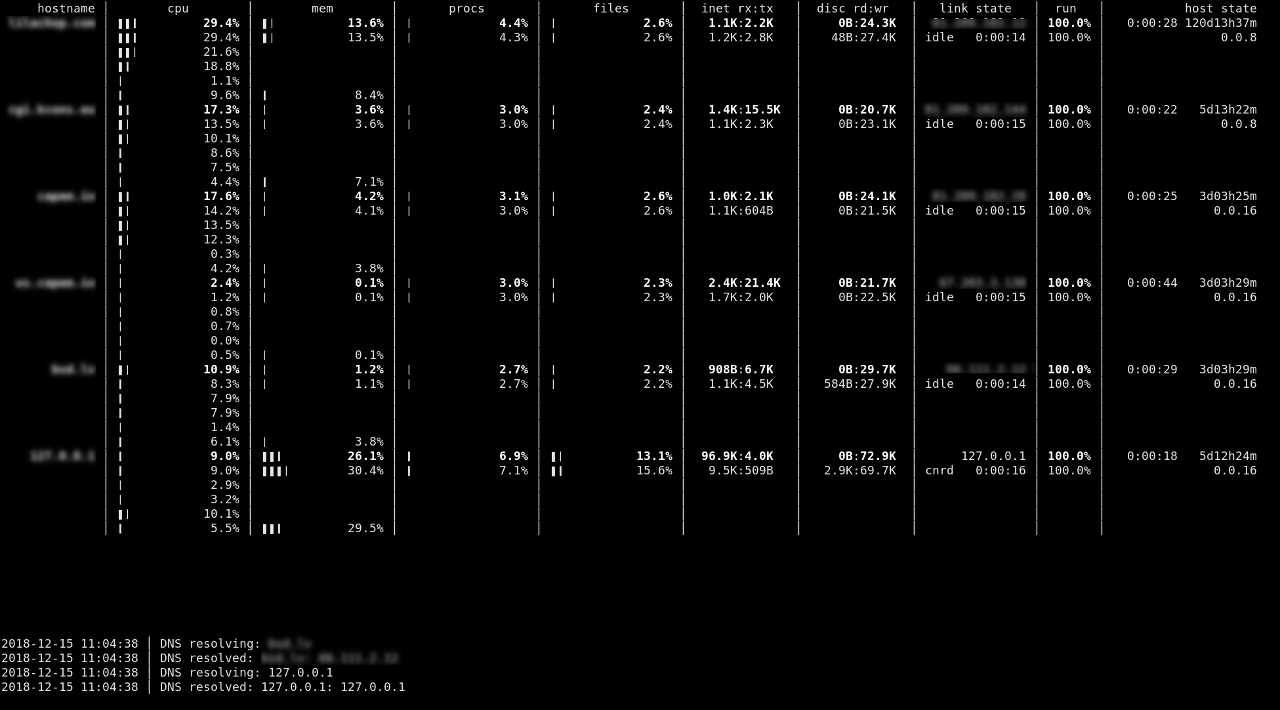
Slant collects enough data to minimally represent system health. A strong focus is on data being finite and bounded: many other system monitors collect and store vast amounts of information. A design goal of slant is to be small and light. For the time being, the following are present as both instantaneous and past averages:
- processor: percentage of non-idle processor time averaged over all processing units
- memory: percentage of active over available memory
- network: inbound and outbound network traffic averaged over configured interfaces
- disc: reads and writes averaged over configured interfaces
- processes: percentage of running over possible processes
-
runnables:
percentage of configured processes (e.g.,
sshd
) currently running - files: percentage of used over available open files
Beyond numerical (aggregatable
) data, slant also records the system boot time, operating
system information (architecture, version, release), and timestamp for
computing clock drift.
Data represented by slant has three types. The first is aggregatable and always numerical. This, like CPU percentage, may be aggregated over time intervals for examining historical average records. The second is start-time data, which is set when the collector daemon starts. This is hardware configuration, system boot information, collector version, etc. The last is non-aggregatable instantaneous information, for example, a list of all processes. At this time, slant collects no instantaneous and little start-time data. This is intentional: the focus is on aggregatables.
download
The current version is always available at snapshots/slant.tar.gz.
Just unpack the source, configure with ./configure, then
run make.
Lastly, run make install as root.
Then make sure the collector, slant-collectd is running
and slowcgi (for
OpenBSD) is properly configured.
You'll need openradtool
to build the system.
For upgrading the database between versions or installing the initial database, make sure to run slant-upgrade. Make sure that the CGI script isn't accessable before you do so, or you may have new CGI sources and an old database schema.
news
about
Slant was built to provide simple monitoring of a set of systems. The operative term being simple, both to deploy and to actually monitor. Development is generously sponsored by CAPEM Solutions, Inc.—thank you!